If you are a frequent visitor of this blog, you probably already know by now that I’m a big Power BI fan thanks to its endless customization options, especially in the Power Query editor. However, I will take a step back today. Not everybody needs to have an advanced and super-customized reports. In this article, I will focus on Google Data Studio while using “Ad Data + Google Analytics” connector from Supermetrics. My goal was simple: I wanted to create a simple dashboard combining data in 1 table from Google Ads, Microsoft Advertising (aka “Bing Ads”), and, of course, Facebook Ads. Probably the most frequent combination we all use.
In this review, I will describe mainly the connector setup process which seems to be a bit clunky at times.
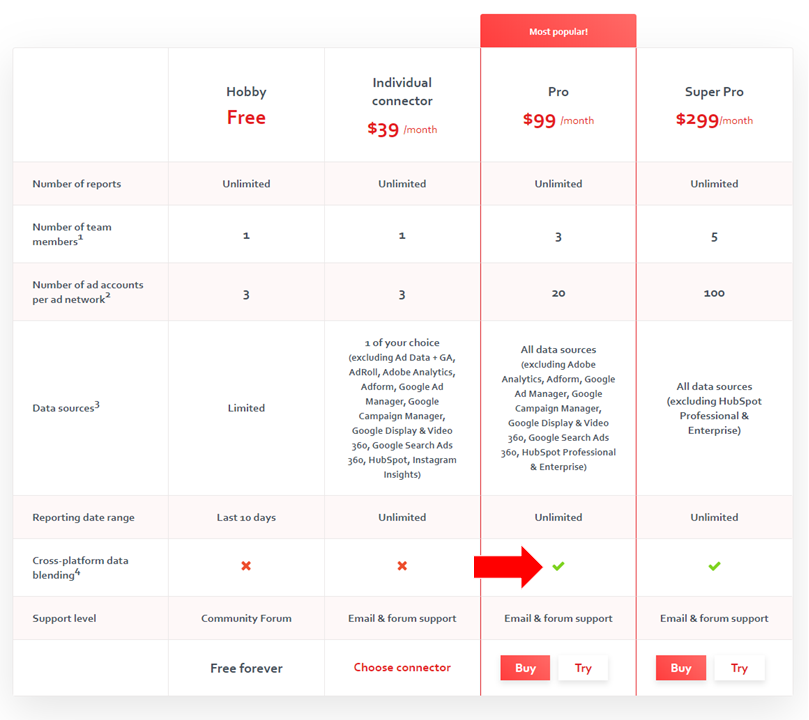
At first, I visited Supermetrics for Google Data Studio pricing page to actually figure out which version of the Google Data Studio connector I need.
At the beginning, I stated I need Google Ads + Microsoft Advertising + Facebook Ads data to be available in one table. This means I need to go for a connector which offers “cross-platform data blending”. What is “data blending” anyway? Imagine you have:
- 1 table of performance data from Google Ads
- 1 table of performance data from Microsoft Advertising
- 1 table of performance data from Facebook Ads
You take the 3 tables and stack them on the top of each other to create “one unified table” like this:

The added value of this “data blending” operation is that you can then calculate e. g. combined CTR across all the 3 data sources or you can simply see all the data in one table (unlike creating 3 separate tables for each data source).
So back to the pricing, I chose the “Pro” tier for $99/month (trial of course). Is that expensive? Well, it’s not cheap. However, given the fact that you likely spend thousands of dollars every month, paying $99 for something which saves a ton of time every month is not a bad deal at all. If you are a big agency, you will likely need to go for Super Pro version which allows you to have up to 100 accounts per ad network.
I can see one scenario where the “individual connector” option is good enough and that’s the situation where you import ad network data in Google Analytics in the first stage. You just buy the individual connector for $39/month and then you just connect to Google Analytics which also feeds the basic data (cost, clicks) e. g. from Facebook Ads. Otherwise I don’t really see where the “individual connector” would suffice, especially today in the multi-ad-network environment.
When I clicked the “Try” button on the pricing page, I was just taken lower on the page and chose the very first “Ad Data + Google Analytics” connector:
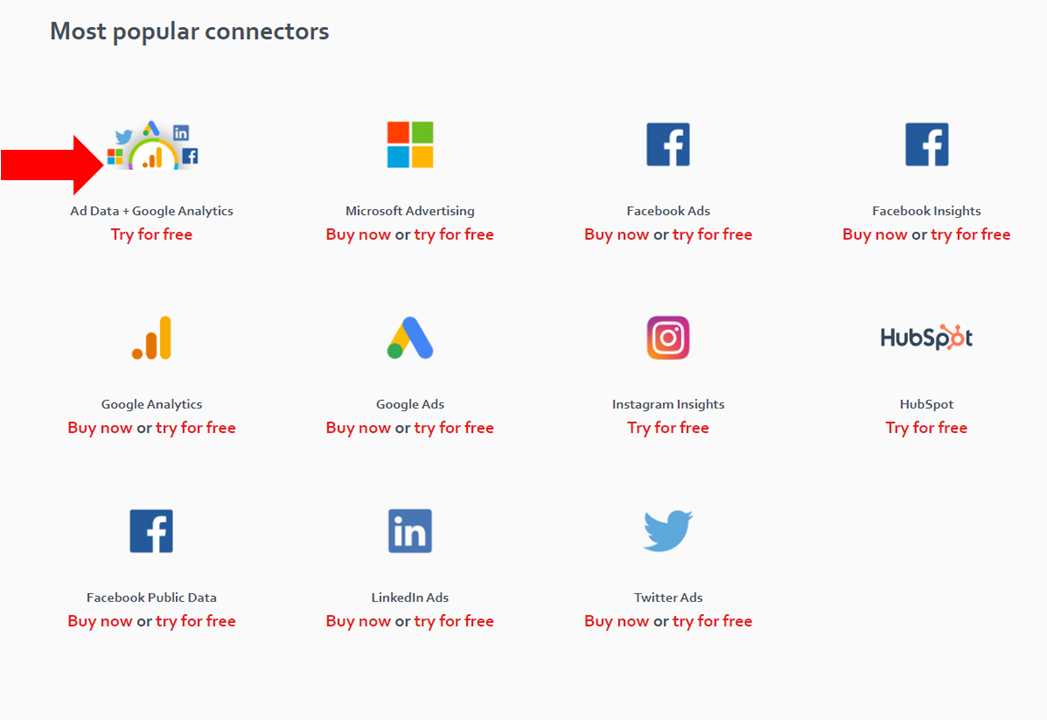
Hands down to Supermetrics for creating this “all-in-one” connector for top 5 advertising networks.
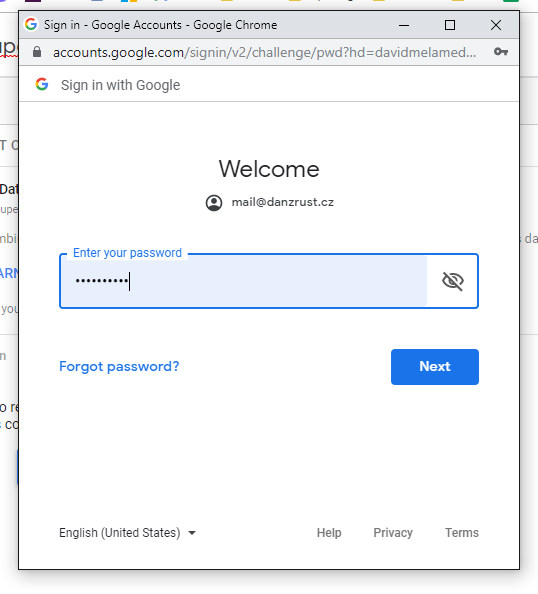
In the following steps, the “authorization party” begins. First, you need to authorize Google Data Studio itself.

You go through the usual Google auth flow:

Then you just enter your password:
As the next step, I got a prompt to authorize with Facebook, so I did:

I succeeded, I could see my account name in the authorization window:

And then I was taken to the basic setup screen for the “Ad Data + Google Analytics” connector. Since I’ve authorized with Facebook so far, I could not see any options for Google Ads nor for Microsoft Advertising (yet).

You need to select which FB account you are interested in. You can select 1-20 (that’s GOOD!) accounts. You need to select your conversion window, reporting timezone, and “report time of action stats”. At first, I had zero clue what “report time of action stats” actually means. However, it’s quite simple to explain – you need to choose whether you want to attribute the conversions back to the date of impression OR to the “date of happening” of the conversion.
Then I tried to connect to Google Ads and to Microsoft Ads but I somehow got into “nothing-was-working-loop”. I tried to authorize with Google Ads over and over but nothing was really happening. Luckily, it seems like I was not the only one to encounter the problem because I soon noticed this note and the link which allowed me to authorize with Google and Microsoft in a new browser window:

After I clicked the link, I was taken to this “menu”, where I was able to authorize with the remaining sources. In my case, it was Google Ads and Microsoft Advertising:

After I was done with authorizing, new options popped out on the main config screen. I was now able to see Google Ads and Microsoft Advertising as well:

There is an option to add a list of Brand keywords for Google Ads so the dimension “Branded vs Non-branded terms” knows which keywords to work with. Honestly, I don’t understand why this option is not available for Microsoft Advertising as well.
After you are done on this config page, you just click “Connect” in the top right corner of the screen. In my case, the screen says “Reconnect” because I was going back and forth between data sources and the report itself when writing this article:

Once you connect, you are asked whether you want to add your shiny new connector to a report. Obviously, you want to – so click “Add to report”:

A few seconds later, a blank dashboard in Google Data studio will load. It will look something like this:

After 5 minutes, I was able to create a very ugly report reaching my original goal of combining data from Google Ads, Microsoft Advertising, and Facebook Ads into one table (and a line graph):

Pros of using Supermetrics for Google Data Studio
- Man, that was soooo easy and so fast! It literally took me about 30 minutes to figure this out from start to finish. Truth to be told though – I mess with data all day long across multiple systems so it may take you longer if you are totally new to this world.
- Supermetrics connector will automatically create a few time-intelligence dimensions such as Year, Year-Month, Year-Week
- Supermetrics connector will automatically import keyword level data, ad level data, and location data.
- Everything happens in your browser, you don’t really need to install anything on your PC – good when you don’t have admin rights on your company PC.
- This works both for Windows and Mac because, again, everything happens in the browser.
- The dashboards are sharable like any other Google product.
Cons
Some of the negatives are not necessarily about Supermetrics itself but rather about Google Data Studio limitations.
- The authorization process was a bit cumbersome. I can see how some no-so-experienced users do not succeed and give up right at the beginning.
- Some metrics’ names are little odd. E. g. “Link Clicks” represent “Clicks”.
- The default visual designs of Google Data Studio are so ugly. Or is just me?
- Frequently, even small change makes load/refresh Google Data Studio for a really long time.
- The visuals are wasting space – lot’s of blanks spots everywhere.
- Visuals are not scrollable, but they are rather paginated.
- Seems like there are some serious limitations on how much data can be pulled into Google Data Studio as per this note from Supermetrics: Data Studio connectors can currently only handle queries that take less than 6 minutes to run. If you encounter performance issues, we recommend using our Google Sheets add-on (https://goo.gl/rt5G9S) to fetch the data into Sheets. Set up an automatic refresh in Sheets, then use Data Studio’s Google Sheets connector to access it in DS. I can see how you could run into troubles if you run an account with millions of keywords.
- You are quite limited in creating custom metrics in Google Data Studio. Compare formulas available in Data Studio vs DAX available in Power BI .
Conclusion
It’s amazing to see how far the reporting technology has come in the recent years. You are now able to create an automatically refreshed reports within minutes combining multiple data sources and you don’t have to be a data analyst. If you are not really demanding and you want to just quickly see basic metrics, I think Supermetrics for Google Data Studio can be your choice.
If you need to do some serious customization, create complicated metrics, have nicer default visuals, and have more interactive dashboards, I think you should go for Microsoft Power BI .
If you want to read more about digital marketing reporting, you continue with these articles:
- Supermetrics for Google Sheets & Power BI: The Ultimate PPC Reporting Combo
- Google Data Studio vs. Power BI
- Having Troubles with Setting Up Your PPC Reporting Architecture?
Well said. Like you, i’m a Power BI fan as well but last I checked it doesn’t support advanced segments which is a limitation and why I also bounce back and forth.