Let’s get to Power BI basics today. You might be wondering, what’s the difference between “Merge” and “Append” button in Power BI‘s Power Query Editor. This article will explain that. The short story is that:
- The Merge button is an equivalent of JOIN in SQL. It’s also similar to LOOKUP function in Excel, but behavior is different when multiple matches are found. Read more to find out.
- The Append button is an equivalent of UNION ALL in SQL

If you are just starting with Power BI, the short story explanation may not be enough for you. So let’s have a look at our simple problem:

We need to:
- Consolidate tables 1 and 2 into one new table
- Lookup the colors from table 3 for the new consolidated table based on Item ID
This is how the end result should look:

The best part is that it’s not as difficult as it looks – in fact, you can just keep clicking buttons in Power BI UI.
Lazy to go trough this exercise? Buy the finalized PBIX file right away:
Append in Power BI in Power Query Editor
So basically, we need to move contents from the table in the middle “into” the table on the left. The end result should be a new table.

You need to start by loading your Excel file as data source in Power Query editor in Power BI. You can use the same file as me which can be downloaded from here for free:
Then open Power BI for Desktop > Get Data > Excel > the Excel file you just downloaded. You should see this:

Select Colors, Items1, Items2 and press the Load button. You will then see this:

And now it’s time to proceed with the Append operation itself:
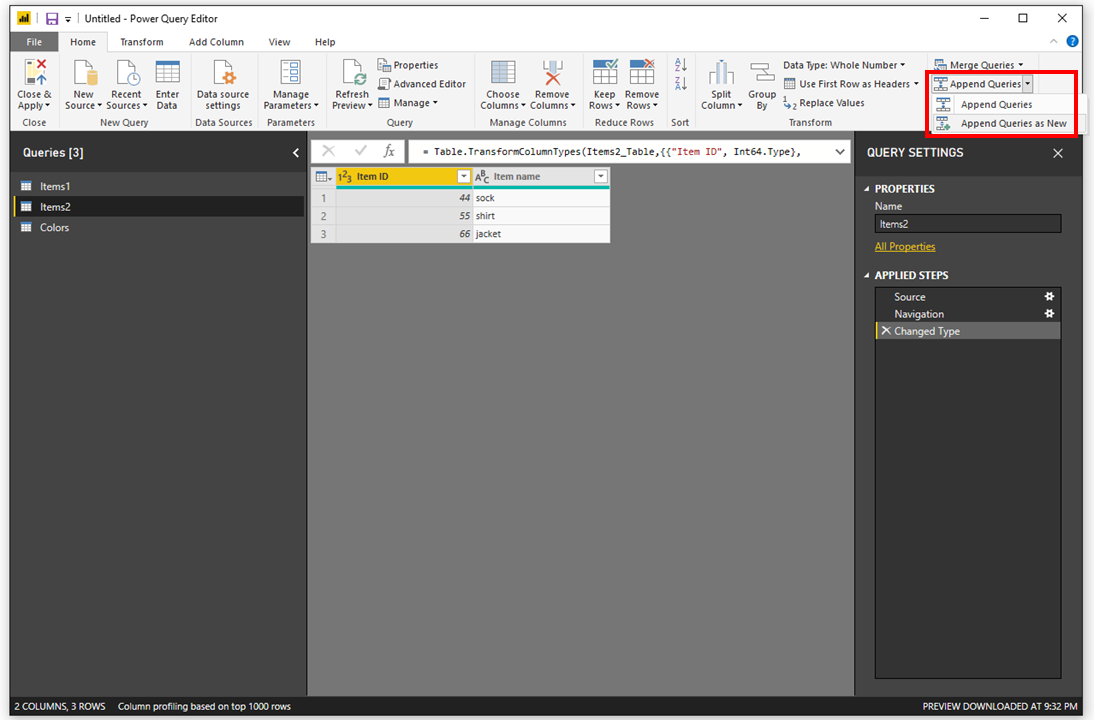
Click the little triangle on the main “Append Queries” button. You’ll get 2 options:
- Append Queries – this operation would add rows into an existing table
- Append Queries as New – this operation will create a new output table from 2 (or more) appended tables. I’m going for this option.
So let’s see what happens after clicking the “Append Queries as New” button:

You either append 2 tables like me OR you can do “Three or more”. So keep in mind your are NOT limited to 2 tables only.
Another important thing is to understand how the tables are actually “appended” together. Power BI looks at column names. If it finds the same columns like in my case (Item ID, Item name) in both tables, it won’t create any new columns and it will fit everything right into those 2 columns. However, if I had e. g. blank space in one of the column names, it would be considered as a new column name: e. g. “Item name” and “Item name ” would be 2 separate columns. The same goes for case sensitivity: “item name” and “Item name” would also mean 2 different columns.
Okay, so you press OK and you get to see the result of your operation. Here is your merged table:
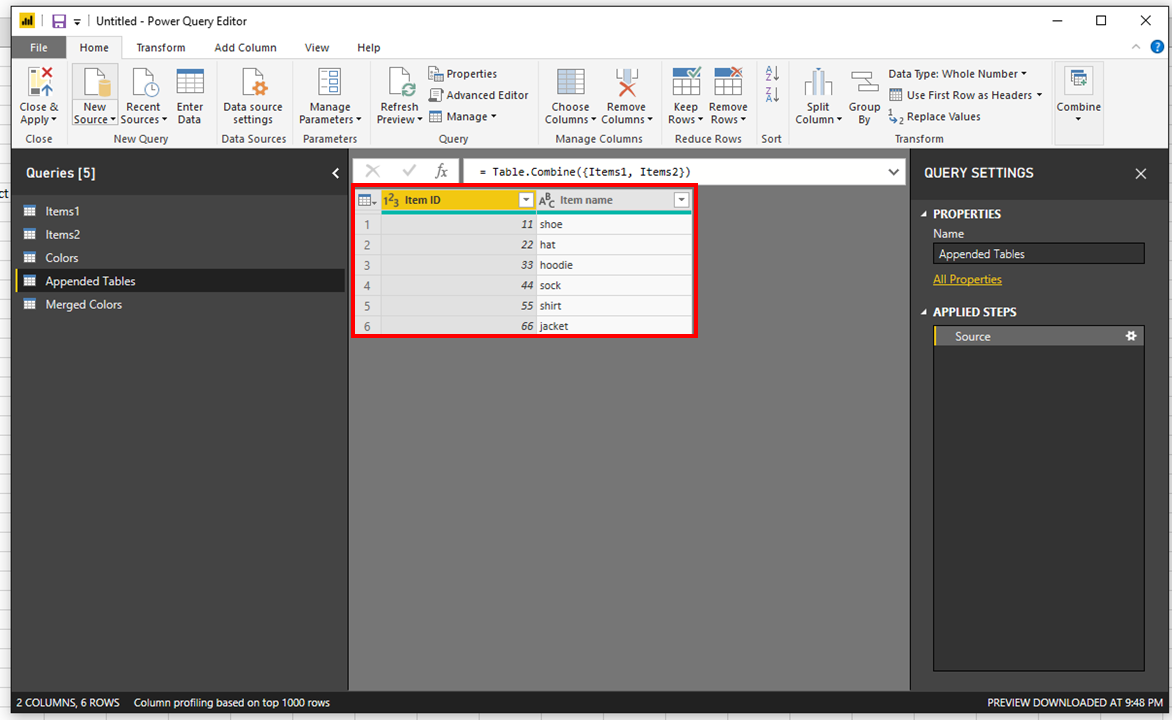
Congratulations, you’ve just finished the Append operation. 🙂
Lazy to go trough this exercise? Buy the finalized PBIX file right away:
Merge in Power BI in Power Query Editor
The second part of the exercise is to find colors based on Item ID for your shiny new appended table. We will use the previous result query “Appended Tables” as input for the next steps.
So let’s locate the Merge button. Again, click the little triangle to see what options you have:

Similarly as with Append function, you have 2 options:
- Merge Queries – you will try to find values from a different table based on a common column between 2 tables. No new table will be created. Data will be matched to the existing query/table.
- Merge Queries as New – you will try to find values from a different table based on a common column between 2 tables while a new output table will be created. I am going for this option.
After you click the “Merge Queries as New”, a new window will open:

This is obviously the most important part of this exercise. You are basically saying: Find values from table “Colors” for the table “Appended Tables” based on “Item ID” column which is present in both tables.
A few important notes:
- You need to select the matching columns in both tables. In my example, the key column is Item ID. So I selected Item ID in both tables by clicking the headers.
- If you need to match based on more than 1 column, it’s possible. You just select more columns in each table. The order of selection MATTERS.
- The column names do not matter in this case – it’s about the values in those columns, not about column names.
- You can define the Join Kind but you will be usually using “Left Outer” (you may sometimes need to use “Inner”).
- If your table with colors had 2 rows for 1 Item ID, the rows in the final query would get “multiplied” – same as in SQL JOINs. When you run VLOOKUP in Excel and you encounter more than 1 matching row, only the first row is returned. NOT IN POWER BI!!! It’s best to always deduplicate your reference tables unless you really need to “multiply” some tables on purpose.
Okay, once you are ready, press the OK button and you will see your new table (I renamed it “Merged Colors”):

There is a new column appearing. Yay! Click the little arrow and choose which columns you want to show from the “Colors” table:

You can keep “Use original column name as prefix” ticked, you probably do not want to keep Item ID column ticked – otherwise you will have pretty much the same 2 columns in the final query. Press OK and you will see:

Congrats, you just matched colors to your Item names based on Item ID!
Conclusion
Understanding the difference between the Append and Merge operation in Power BI is the bare minimum for every starting data analyst. I hope that this article cleared questions you might have had but were afraid to ask.
What’s next? You can try to recreate the Power BI file yourself OR you can buy the final PBIX file for $10 (the default Excel file is also included) here: