Supermetrics for Excel is one of the last products from Supermetrics which I had not interviewed. In today’s article, I will walk you through its setup process, the good, and the bad of the DESKTOP version of the product. So please by seated and let’s start.
Why Would You Even Want to Use Supermetrics for Excel?
We all know Supermetrics already have a product for pulling data into Google Sheets. The thing is that Google Sheets are not ideal for storing large amounts of data. Google Sheets can currently handle only 5,000,000 cells (rows x columns) max. It sounds like a big number but it’s not – you can quickly run over the limit e. g. if you are trying to pull day by day keyword report in a large account. There is no limit for cell count in Excel. Excel can take much more than 5M cells but you are still limited to 1M rows per sheet (not spreadsheet). So even though Excel is not ideal either, it can store way more data than a Google spreadsheet.
Another reason is that Google Sheet have less sophisticated features than Excel. Google Sheets are for example missing my favorite Excel’s feature – Power Query. You’ll learn more about it towards the end of this article. Power Query is one of the reasons I’ve decided to review the desktop version of the product (there is also a version for “online” Excel from the 0365 suite).
The third reason may be simply politics – your organization does not allow you to work in Google Sheets but you still need to store your marketing data somewhere and Excel is the solution for most of the users along with Supermetrics for Excel.
Covered Marketing Platforms
Supermetrics for Excel allows you to connect your Excel to all the important marketing platforms such as:
- Google Ads
- Microsoft Advertising (aka Bing Ads)
- DoubleClick
- Google Analytics
- Search Console
- Adobe
- Quora
- Snapchat
- Youtube
- Yahoo Gemini
- …and much more
So Where Do You Start?
The good news is that there is no commitment if you just want to try it out. You simply start a 14 day trial without even entering your credit card – that’s a fair deal. Click the button below and you’ll be taken to their landing page.
On the landing page, click “Start Free Trial”:

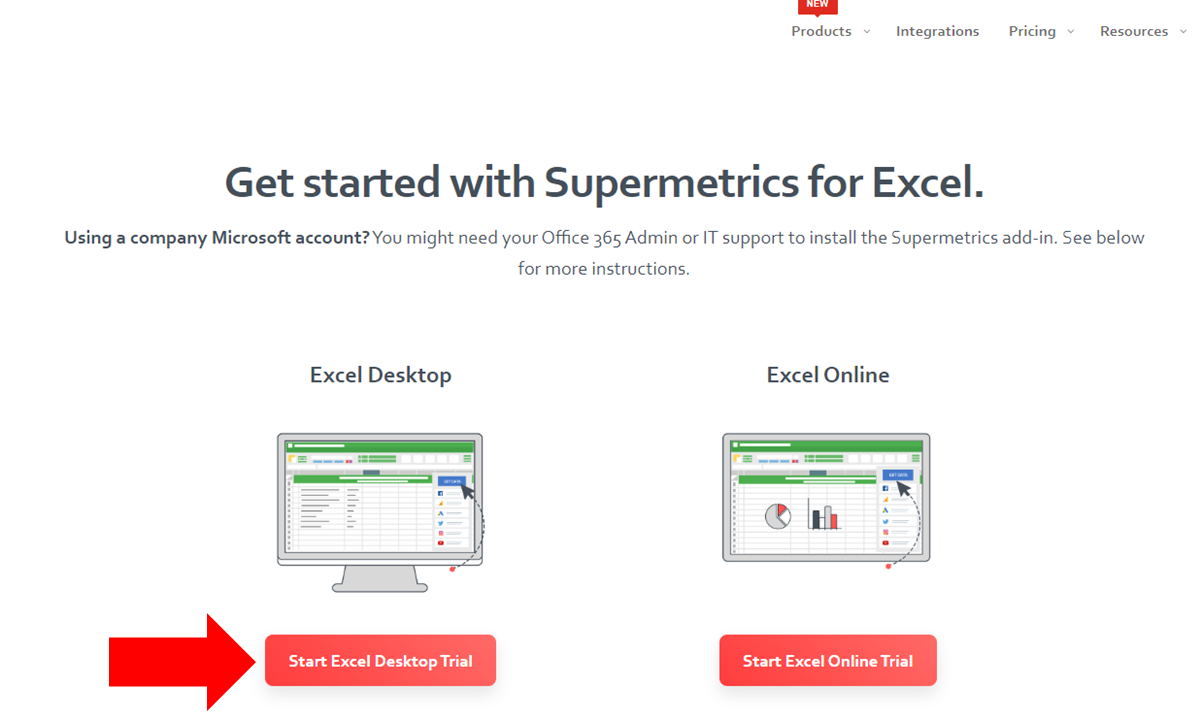
Then choose “Start Excel Desktop Trial”:

You’ll be taken to Microsoft’s page, click “Open In Excel”:

Depending on which browser you use, you may get a prompt. This is what you will see in Chrome. Click “Open Excel 2016”:

A standard Excel file file will soon open with a shiny new Supermetrics pane on the right side. Click “Trust this add in”:

At this point, you’ll likely be asked to start your trial. I was not because I had started the trial before writing this article. After you officially start the trial, you will see a new button on Data ribbon in Excel. Click “Got it” and then “Show Supermetrics”:

Now the more interesting part starts. If you are familiar with Supermetrics for Google Sheets, you’ll be surprised how similar the next steps are. The right hand pane in Excel is very similar to the right hand pane in Google Sheets. In the first step, you need to connect to your Data source. Unsurprisingly, I will start with Google Ads.
So in the data source list, select Google Ads:

Then it’s time for authentication with Google. After selecting Google Ads, you’ll see this:

Your browser will open and you’ll be asked to select with account you want to authenticate. It’s very convenient that your Supermetrics licence email can be different from the email which you use to login to all the marketing platforms.

You have no option but to agree:

Great success! You are now done with authenticating with Google Ads:

You can now go back to your Excel where you can finally start editing parameters of your query. Select the account from which you wan to pull the Google Ads data. Tip: If you click the MCC names, all the underlying accounts will be added automatically:

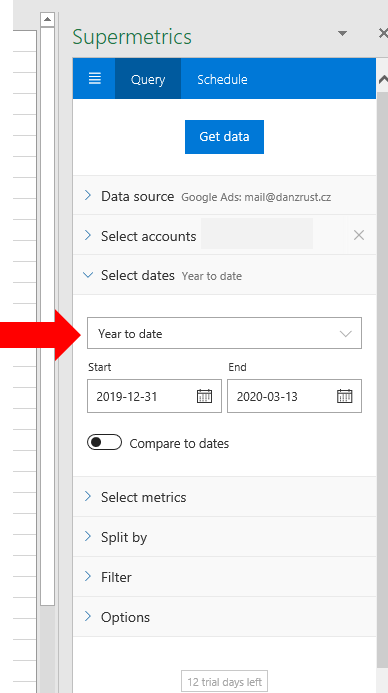
In the next step, define the time period you are interested in:

Then you need to select the metrics, I will be humble and select just a few basic ones:

In the next step, you define the dimensions. There are always suggestions as soon as you start typing – that’s very helpful:

In case you just need a subset of your account data, you can define filters. I need everything so no filters for me:

And the last configuration step for advanced users where you can define several options:

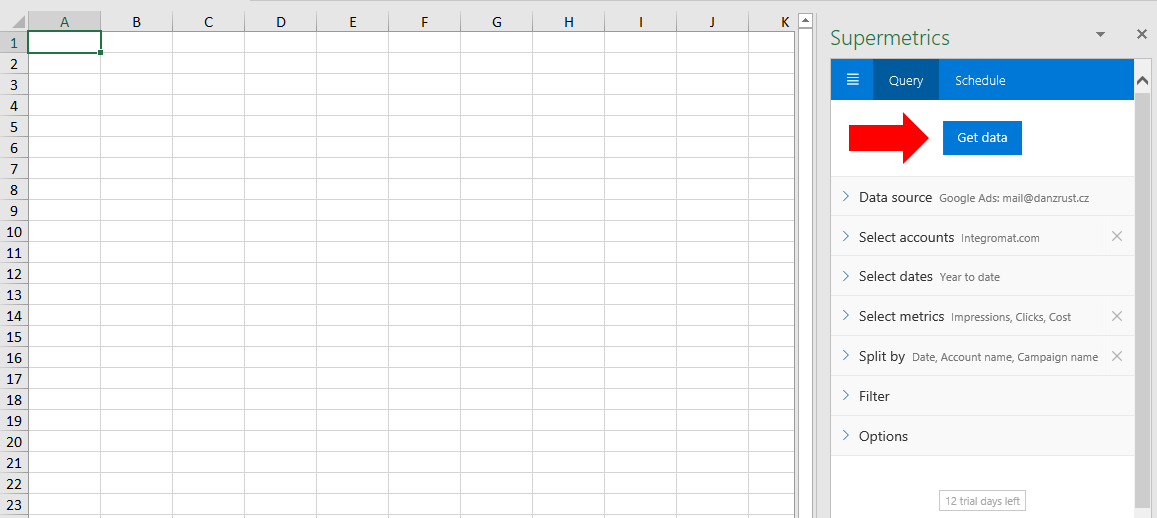
Alright, now we are ready to run the query. Before you press the “Get data” button, go to the cell where you want the new data to be inserted – probably, it’s going to be a new sheet:

This is what I get from my test accounts (yeah, just 2 random impressions) after running the query:

And that’s about it for the query configuration. It’s not that difficult – is it?
Now you can repeat the process with all the other platforms you need to download the data from – keep in mind that the authentication process will not be the same but still quite similar.
For this exercise, I’ve also downloaded Microsoft Advertising data which I will be combining with Google Ads data into one beautiful pivot table in the last step so stay tuned. 🙂
Editing the Queries
If you want to edit existing queries, you need to select one of the cells with downloaded data and the right hand pane will start showing these options after a few seconds:

Config Sheet
Once you run your first query, a “SupermetricsQueries” sheet will be created – it stores the config info for all the individual queries. It looks the same as Supermetrics for Google Sheets. On this sheet, you will find affected cell ranges, statuses, query config details and all the geeky stuff. You can also change the config directly through the cell values.
Manual Refresh
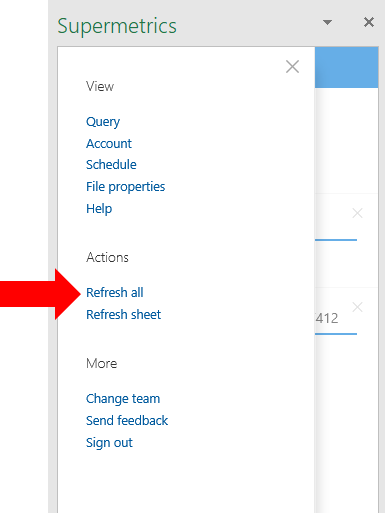
After you open your Excel file with Supermetrics queries next time, you will certainly want to refresh it. Here is how. Open the Supermetrics pane via Data ribbon again. Locate the top left corner:

Find “Refresh All”:
Watch as the queries are refreshing:

And after a while, you’ll see “Results added to the sheet”.

And that’s all for manual refresh.
Scheduling
Similarly to Google Sheets, you can also schedule data refresh in Supermetrics for Excel. However, the scheduling process is not as seamless as in Google Sheets. The main problem is that you also need to have a Microsoft account with email and OneDrive enabled (something like Google Drive in Google’s world) so you may need to create the account just because of your need for scheduling. This is not the problem of Supermetrics, this is more the problem of Microsoft environment.
Not only you have to have OneDrive “enabled”, the Excel file also needs to be stored on OneDrive. So in ideal world, you install OneDrive for desktop and save the file in a synced OneDrive folder. This will enable you to start the scheduling process in the Supermetrics add-on. If you are already using Google Drive for file syncing to your desktop, OneDrive for desktop will be pretty much duplication of Google Drive syncing which may not be ideal.
Another option is to have the file stored in OneDrive via web interface and not have it installed as desktop app. The problem here is that you’d need to find the file via your browser every time you’d want to open it.
Alright, let’s move on with scheduling now. You start the scheduling process by click “Authorize” in the “Schedule” tab:
Your browser will open asking you to log in into your Microsoft account and approve permissions – it needs to be an account with email and OneDrive enabled:

Since I don’t have OneDrive installed as desktop app, I was prompted to save the file to OneDrive, so I went to the browser interface of OneDrive and saved the file there :

I opened the file from OneDrive web interface and finally was able to “Add trigger”:

The next step is similar as in Supermetrics for Google Sheets:
Once you save the trigger, you can add another trigger:

The whole scheduling process is a little complicated. Again, it’s not fault of Supermetrics, it’s mainly the fact that the file needs:
- To live “online” so it the queries can run even when your PC is off.
- To be distributed should you want to be emailed after the refresh and obviously you need an email for that and for this reason, again, the file needs to live “online”.
The whole scheduling experience in Supermetrics for Excel is simply way more complicated than in Supermetrics for Google Sheets.
Taking It One Step Further – Combining the Data in Power Query
Now imagine you’ve successfully downloaded data from multiple engines. In my sample, I have data from Google Ads and Microsoft Advertising. The data is always downloaded to separate tabs. So one tab for Google Ads and one tab for Microsoft Advertising. You will probably want to have this data in ONE pivot table so you can easily slice & dice it. The problem is that the data sitting on 2 different tabs are 2 different data ranges which cannot be used as one underlying data range for your pivot table.
In order to aggregate the data into one underlying table, we need to use Power Query which is only available in desktop Windows Excel.
Check out this 3 minute video which shows how to solve our aggregation problem step by step:
Here are the steps in the process:
- You need to load the data from Excel to Power Query. The good news is that the data downloaded via Supermetrics is stored in named ranges. Named ranges can be used as data sources in Power Query.
- You need to make sure the table headers are the same both for Google Ads and Microsoft Advertising.
- Once your headers are the same, you can append the data into one table.
- Then you can create a pivot table which is using the “virtual table” as data source.
Conclusion
Supermetrics for Excel is a nice addition to Supermetrics product portfolio. While it’s probably going to have lower adoption than Supermetrics for Google Sheets, it can get super-powerful in conjunction with Power Query and there is no cell count limit unlike in Google Sheets.
If you are a table processing nerd and you cannot use Supermetrics for Google Sheets then Supermetrics for Excel is your only choice.
Now a few words about pricing. The cheapest license will set you back $99 per month. You can also upgrade to “Super Pro” for $199 per month (more data sources covered). None of the options are cheap but if you manage thousands of dollars in ad spend every month, spending $100 per month on automating data processing does not sound like a bad deal to me.


Hi,
Very cool. Can this be done in Google sheets?
Hi Leandra,
yes, see this: https://www.excelinppc.com/supermetrics-for-google-sheets
DZ